Picking up where we left off…we’ve been exploring differences in major peer groups to determine whether there is a relationship between outcomes and financial performance.
The newly minted CMS Star Ratings tell an interesting new story following extended delays and input from industry.
No matter what you think of Star Ratings, as Star Ratings improve (Quality) so does EBITDA Margin. It’s a very pronounced relationship.
- Overall, you’ll see the median EBITDA Margins fall as Star ratings fall across all Beds sizes
- The different shape of the EBITDA Margin versus Star ratings for the “25 beds and under” reflects a different distribution of 4-star and 3-star facilities in this size group
- The “26-99 beds” cohort reveals the strongest relationship between a Star ratings and EBITDA margin…even with facilities unevenly distributed across stars ratings
- Significant performance variation still exists among and between star ratings
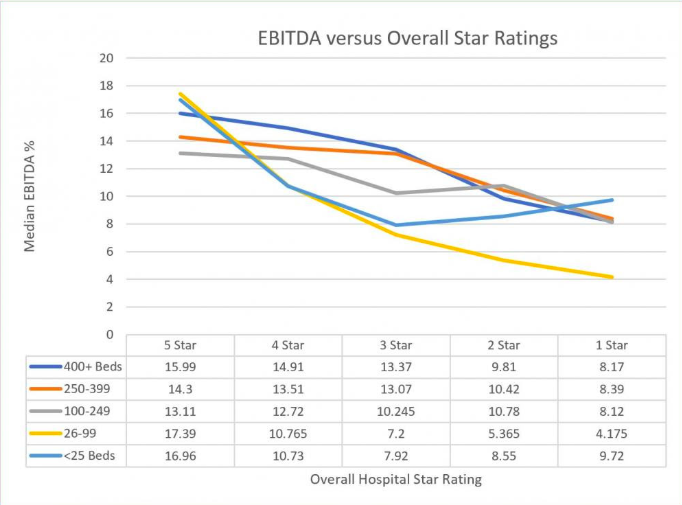
The classic argument that quality is good business is fully in play across the U.S. hospital industry, at least as it relates to a hospitals ability to generate free cash flow.
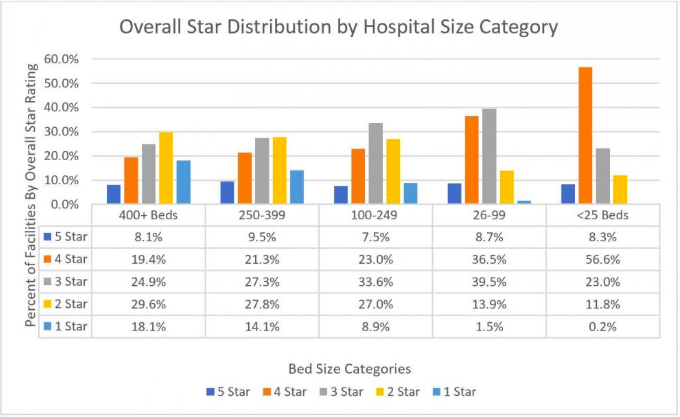
- The controversy that star ratings are not distributed fairly across the size ranges of facilities does rear its head
- In the chart below, the two smallest size ranges have a disproportionately large % of 4-star and 3-star facilities
- What other criteria are worth a closer look? Location? Payer Mix? Social Determinants? Productivity?
Check out these and other important strategic insights for any other performance measures of your choice, against CMS Star Ratings or among 850 other metrics of industry performance. Give us a call to look at your market or metrics of interest.
Franklin:BI curates virtually all healthcare provider data for every year published and ties it together contextually and competitively. Connecting financial and operational performance to outcomes; quality and safety with your own market’s data gets you to better, faster, smarter answers.