It’s a Cage Fight in Austin
HCA and Ascension dominate the second fastest growing US market in what can best be described as a “cage fight”.
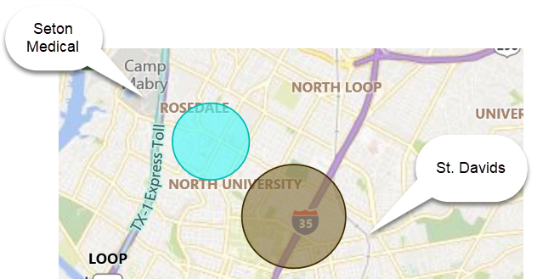
This week’s target hospitals are HCA’s heavyweight St. David’s Medical Center (588 beds) and Ascension’s big Seton Medical Center (448 beds) – both central to each system’s strategy and located minutes apart.
While you’ll see below Ascension’s weakness and HCA’s growing dominance in Austin, these differences are NOT defined by their service line mix however…both are quite similar.

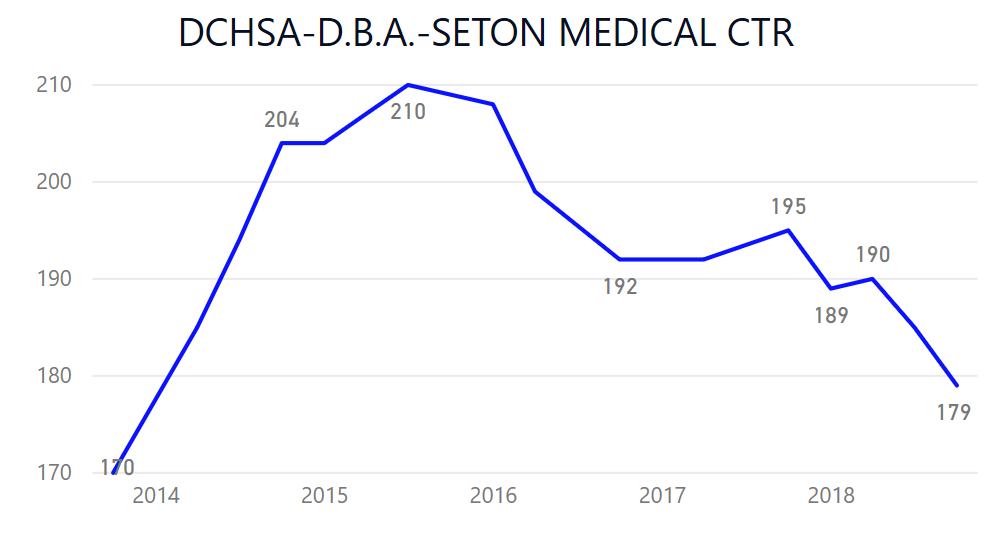
Seton Medical Center
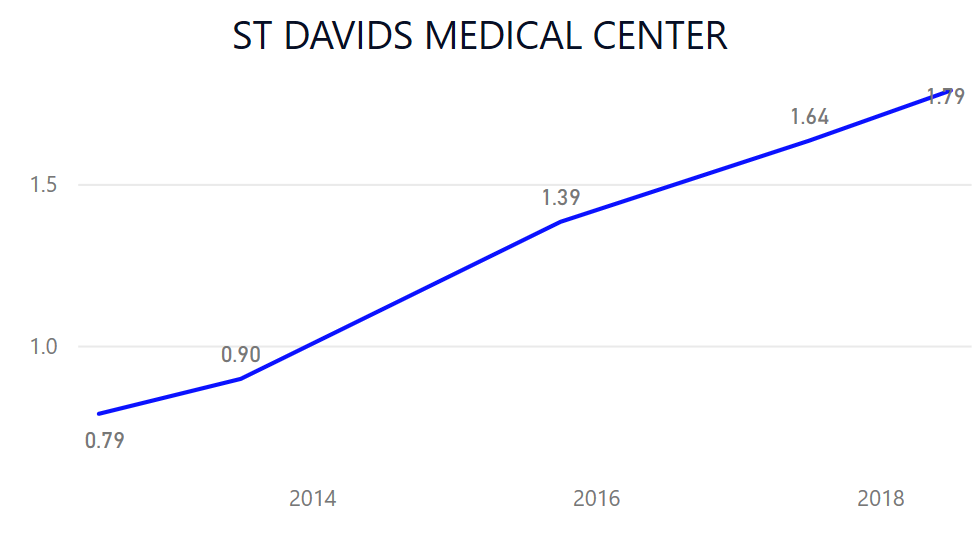
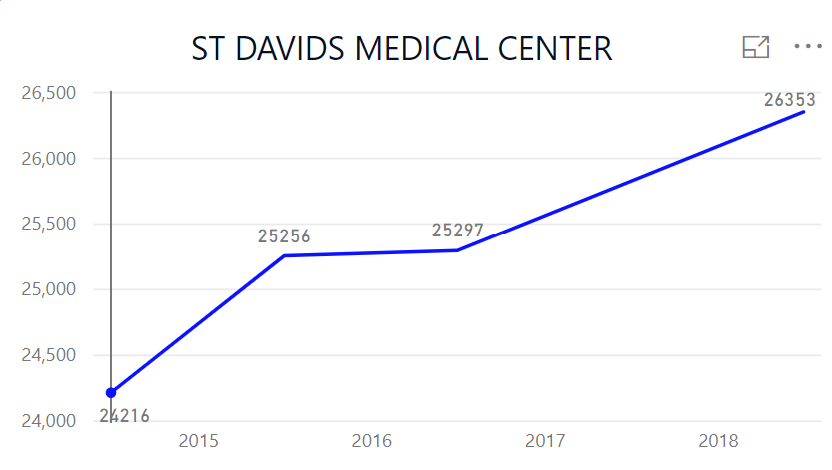
St David’s Medical Center
Let’s look at some key KPI’s, Market Share, and Physician Network first followed by Safety and Quality and VBP outcomes.
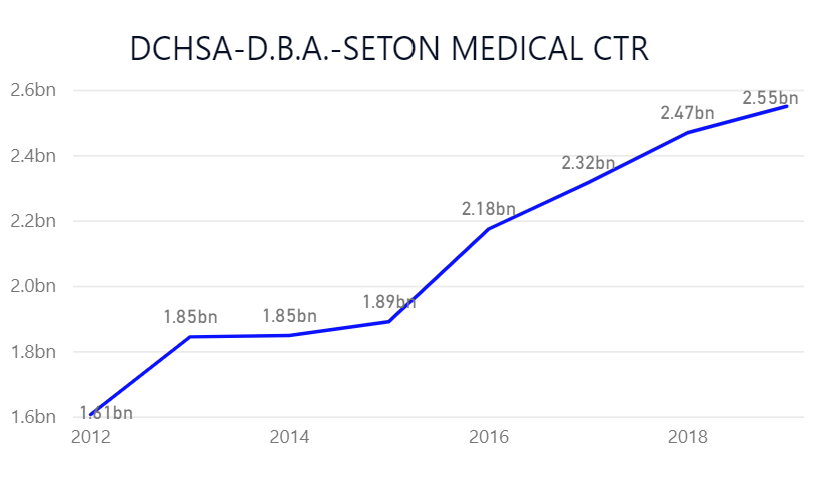
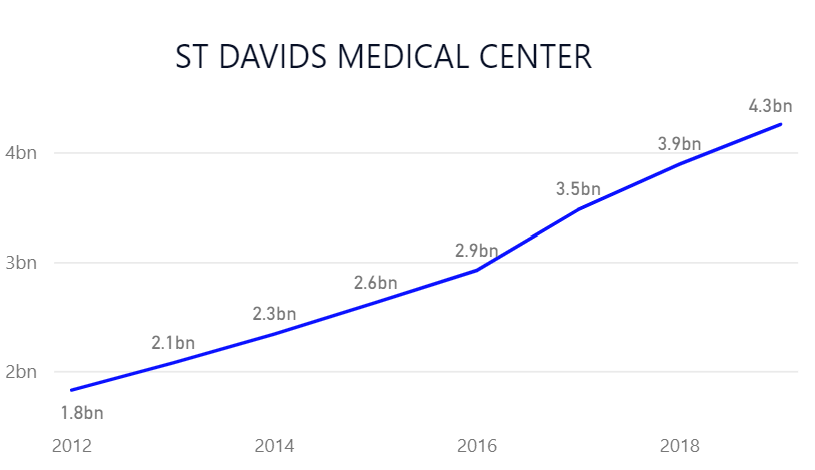
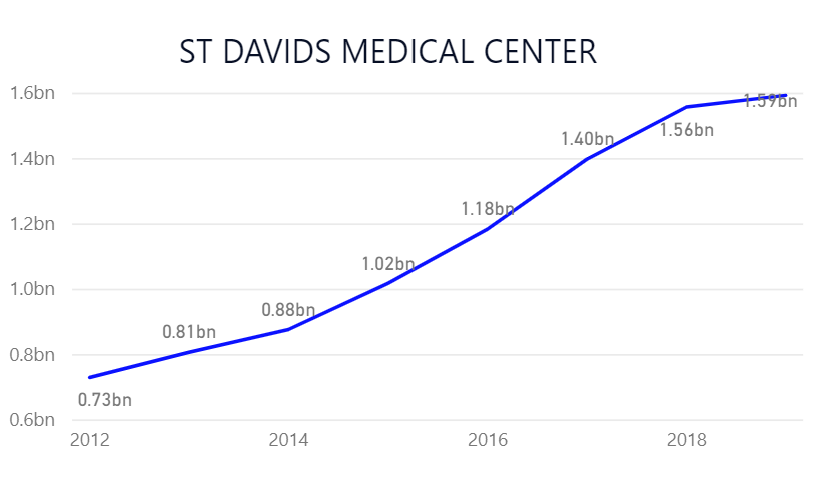
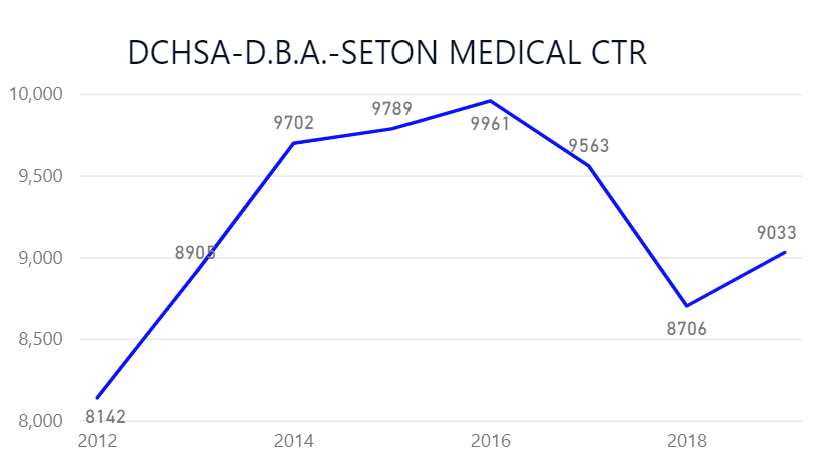
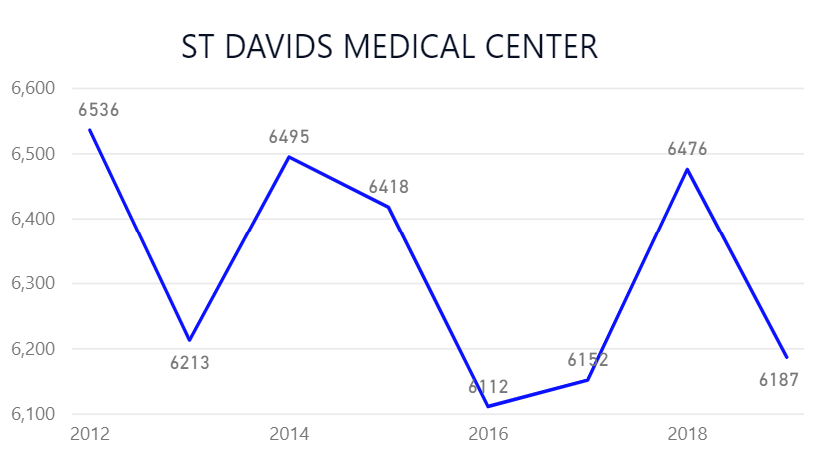
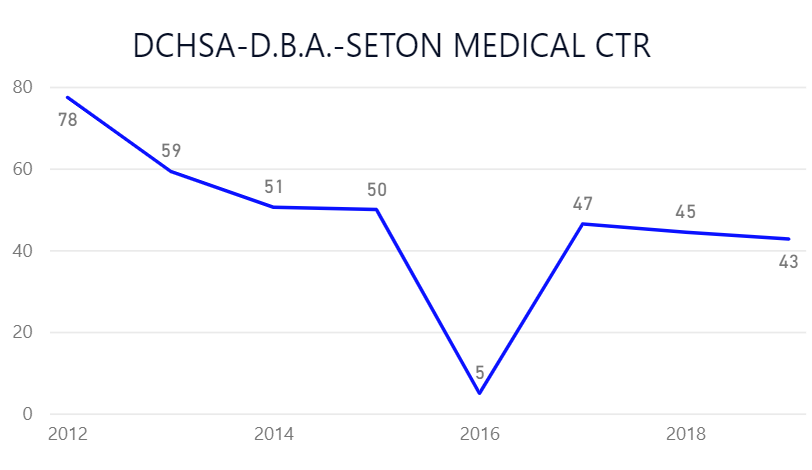
Looking at Total Patient Revenue…you see great trends…though St. David’s CAGR (+13.4%) from 2012 is twice Seton Medical’s (+6.7%) with St. David’s now 80% bigger than Seton in 7 short years.
Total Patient Revenue
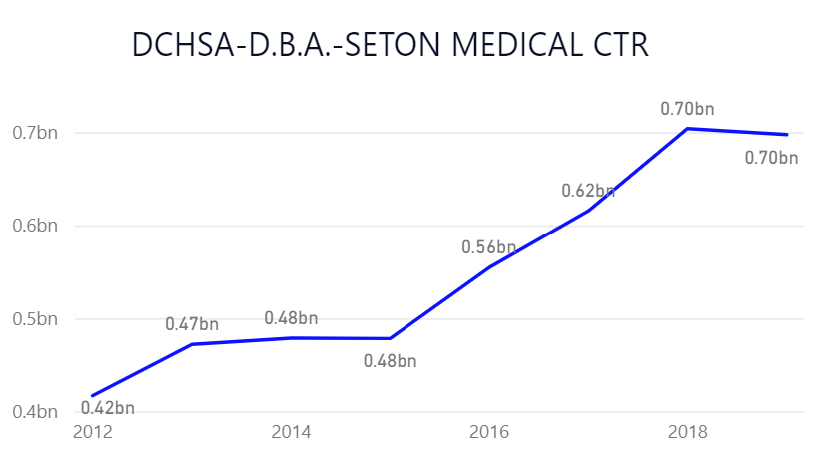
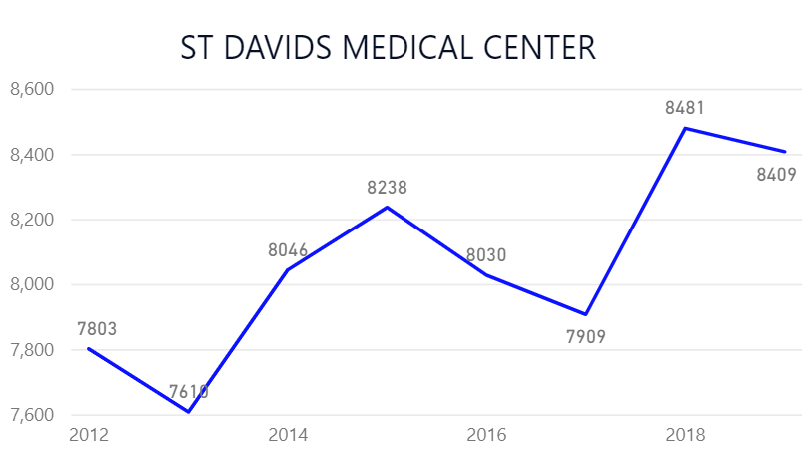
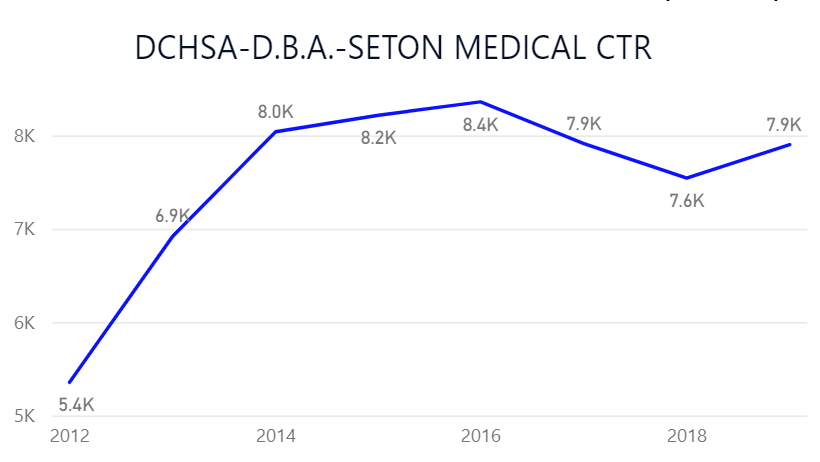
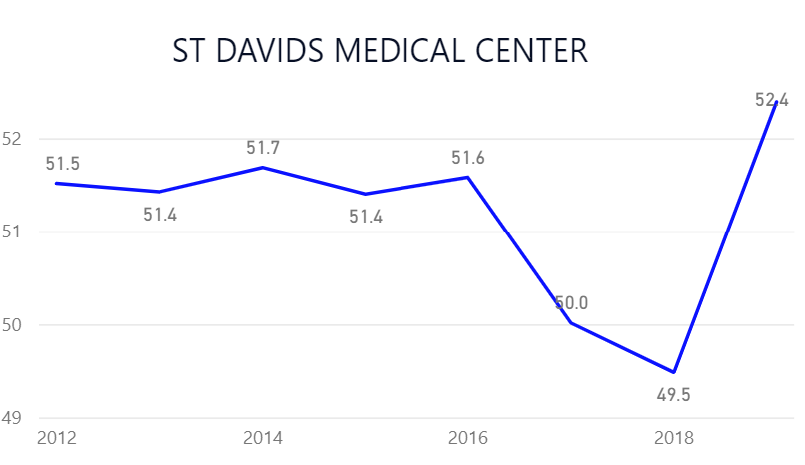
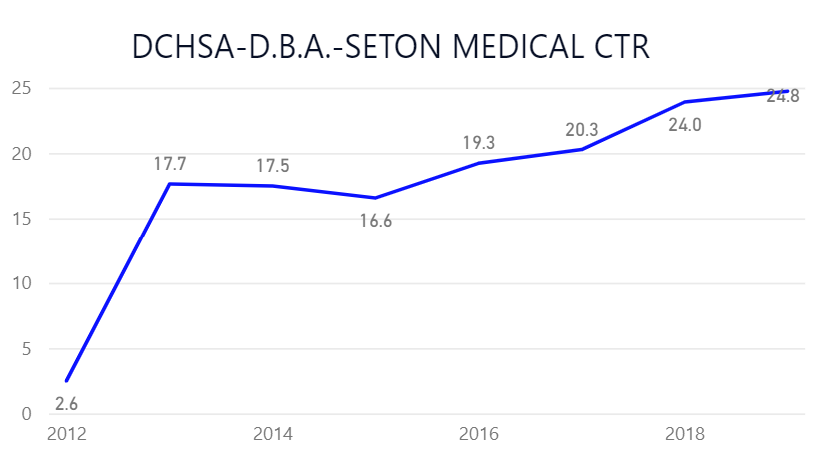
Though not quite as dramatic, Outpatient Revenue at HCA’s St. David’s, CAGR (+12%) from 2012 outgrew Ascension’s Seton Medical (+8%).
Outpatient Revenue
Revenue Growth has a bit to do with Pricing as well, where prices at both hospitals have increased significantly over time.
Net Patient Revenue per Adjusted Discharge, CMI & Wage Adjusted
On the Expense side of the equation, HCA is winning and far more competitive than Ascension.
Expense per Adjusted Discharge, CMI & Wage Adjusted
Overhead Expense %
So, while Earnings for both look very good, Ascension’s earnings are trending down and overall looking battle weary, with HCA clearly winning the early rounds in the cage fight.
EBITDA Margin
The biggest deal of all though, is how all of this this translates to Market Share, especially in the primary service areas.
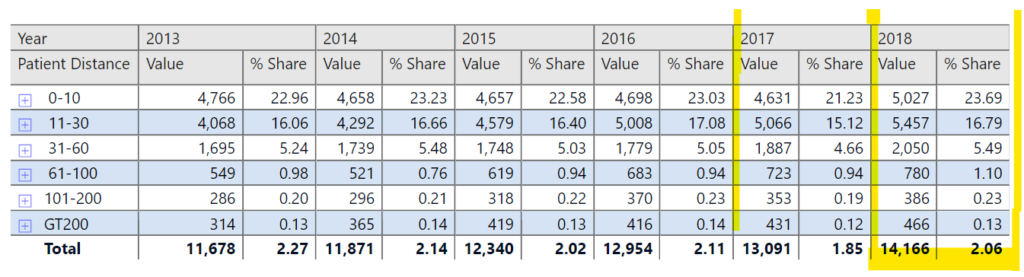
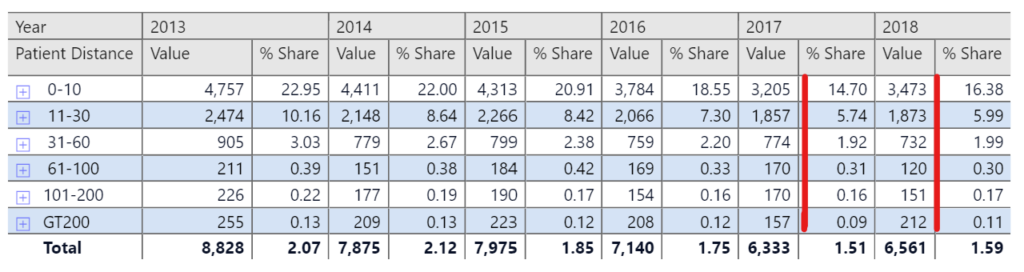
Medicare Market Case Counts and Market Share
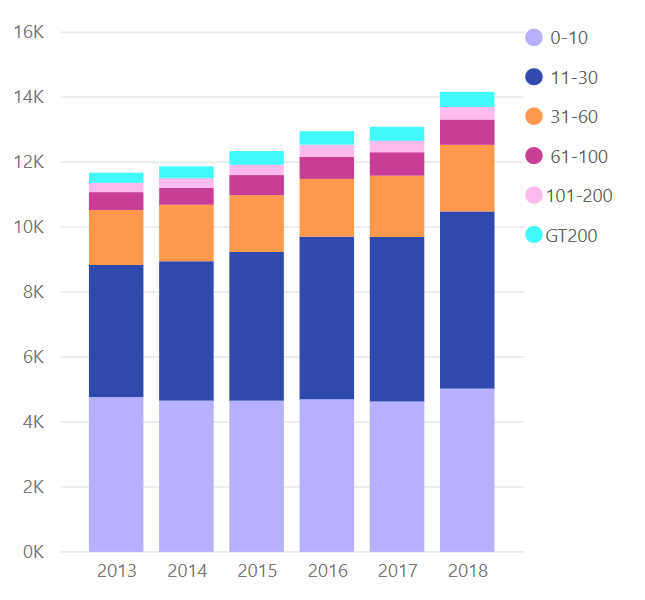
St. David’s - gaining share across all distances with overall higher volumes.
Seton Medical Center - bumpy volumes…including in primary market areas.
In summary, Ascension’s weakness in Austin is masked by market growth. They have a lot of resources but haven’t seemed to rise to the fight… with future rounds harder than this one.
Now, let’s look at Quality, Safety and Pricing Value where the HCA and Ascension cage fight becomes increasingly transparent.
Safety, Quality and VBP Outcomes
The star ratings below show how each stacks up versus this comparison group, (1 star = worst, 5 star = best).
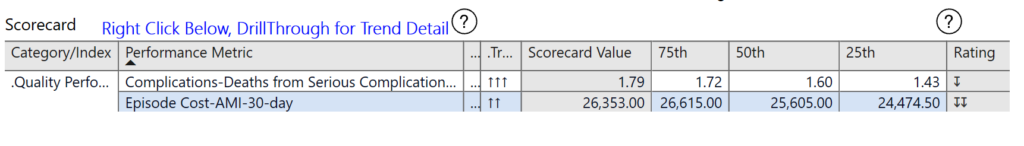
Evaluating the comparative performance of St. David’s and Seton Medical for 58 critical metrics organized into categories, one can see that HCA’s St. David’s continues to significantly outperform Ascension’s Seton Medical.
Major categories of Serious Complications, Critical Outcomes (mortality and infections), and Patient Satisfaction stand out, while Readmissions, Excess Days, and Episode of care metrics are quite even, with a nod to Seton.
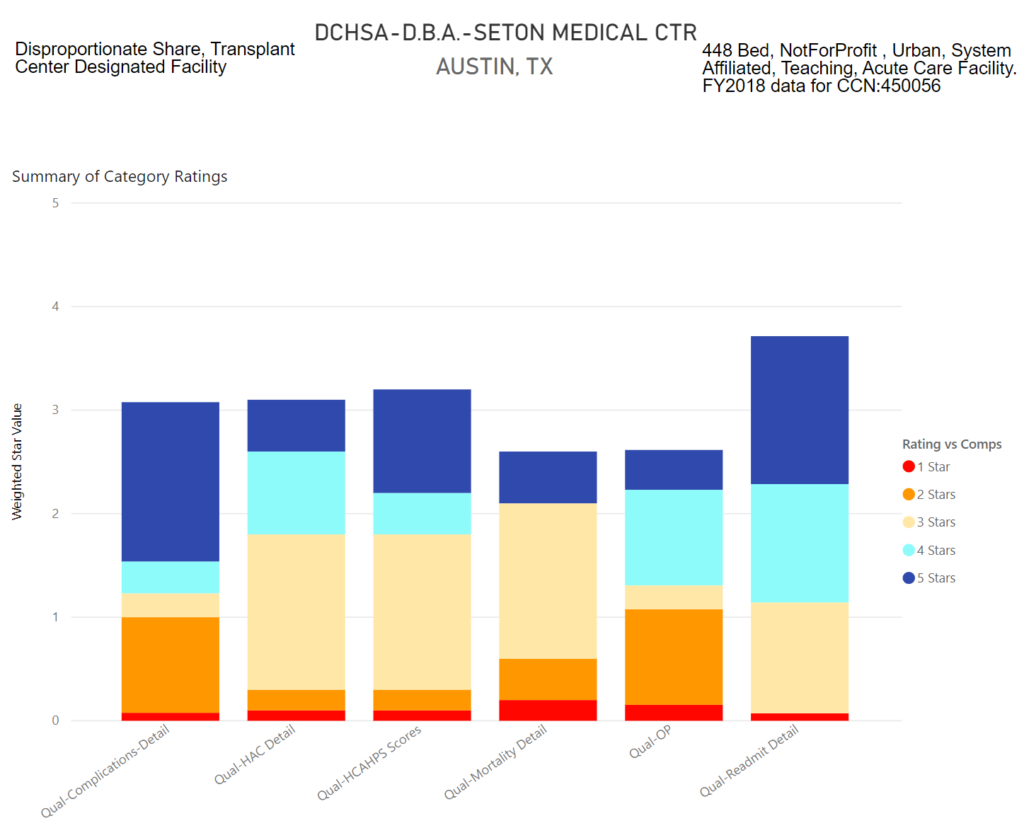
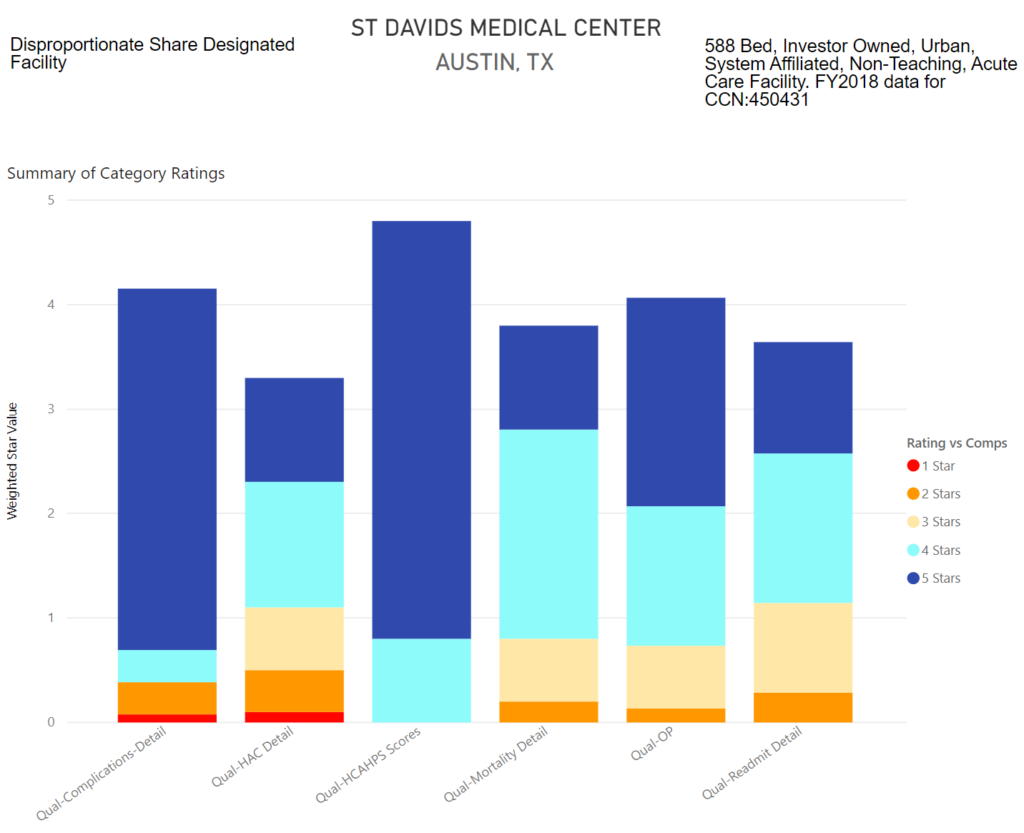
Among key Outpatient Quality Performance metrics St. David’s continues to outshine Seton, though the contest is not so one sided.

A good way see what’s going on is to drill down and look at quality & safety indicators performing at 1 and 2 star levels that are also trending the wrong way.
20% of Seton’s 58 metrics have a 2-star or lower rating and are worsening versus the TX hospital peer group. While that’s better than average, it’s still significant and outperformed by St. David’s.
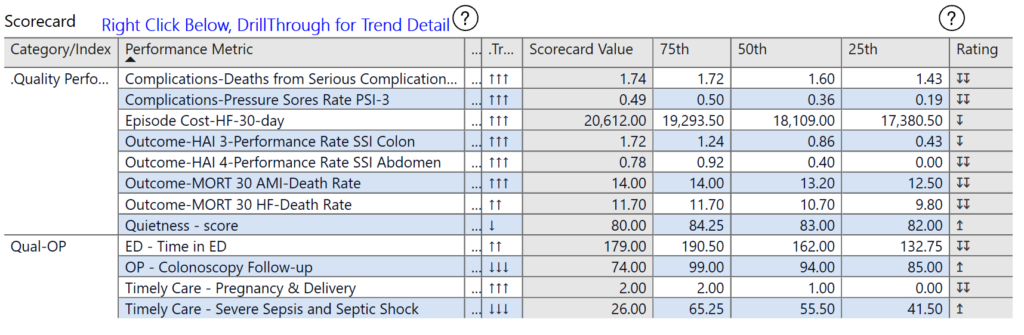
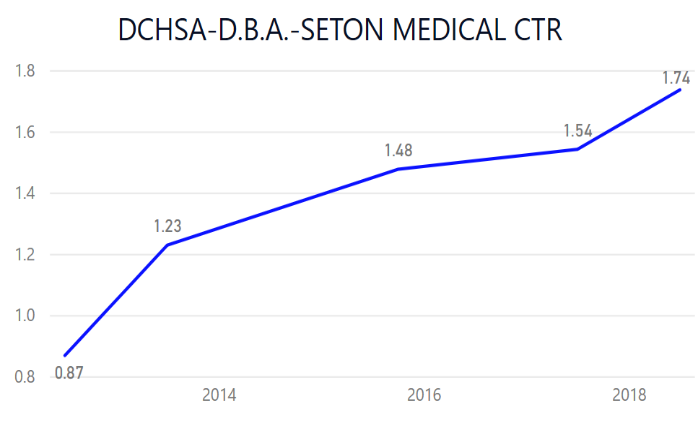
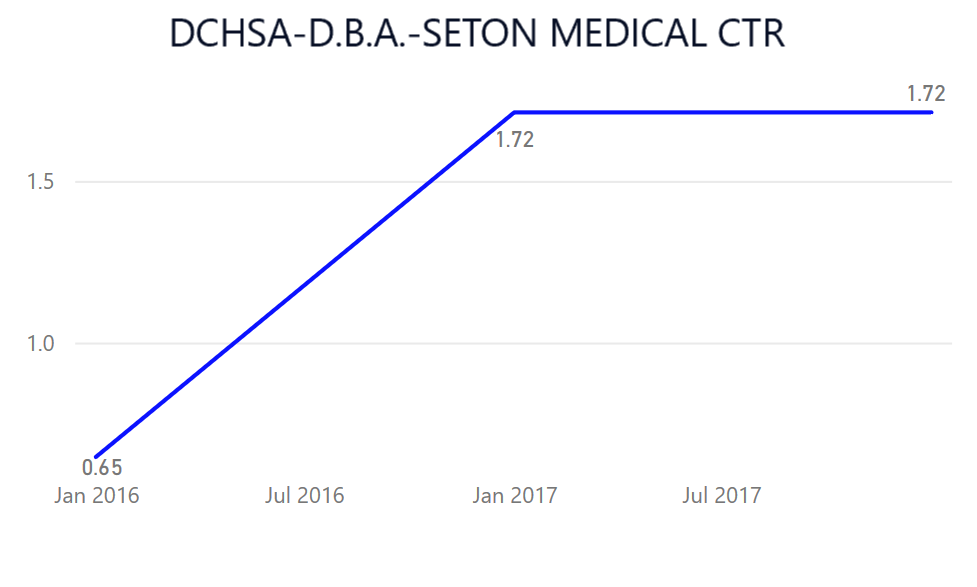
Deaths from Serious Complications Post Surgery and Hospital Acquired Surgical Site Infection: Colon Surgery, are very critical safety metrics. Both are trending the wrong way and are 2-star performers (among TX facilities 250 beds and larger).
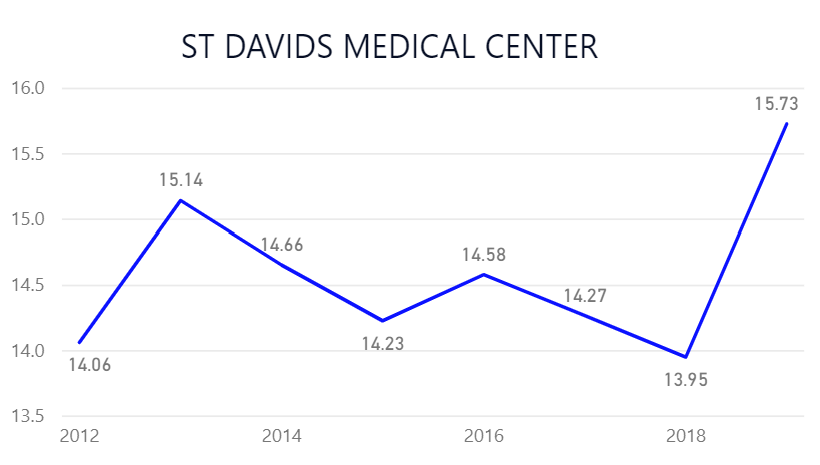
Time in ED
Time in ED is almost back to 2013 performance levels but remains a 2-star (the bottom 40th percentile.)
St. David’s has only 2 metrics performing at a 2–star level and worsening. That still doesn’t give them a free pass for Deaths from Serious Complications; Post Surgery, or increasing Episode Costs for AMI, but it’s an impressively short list.
St. David’s outperforms Seton Medical with outcomes that set the standard for America’s second fastest growing market.
This is an example of what you can learn in 30 minutes with Franklin:BI.
So in summary, Ascension’s financial and market share weakness in Austin is masked by market growth. This growth however, cannot mask quality, outcomes, and VBP metrics where Seton Medical comes up short.