2 Tales of 1 City: St. Petersburg, FL – Two health systems on different trajectories…
Nationally, Operating Profit Margins for investor owned facilities are rising. In St. Petersburg Fl, HCA and CHS have very different trends. Below is a visualization of three key indicators of financial performance.
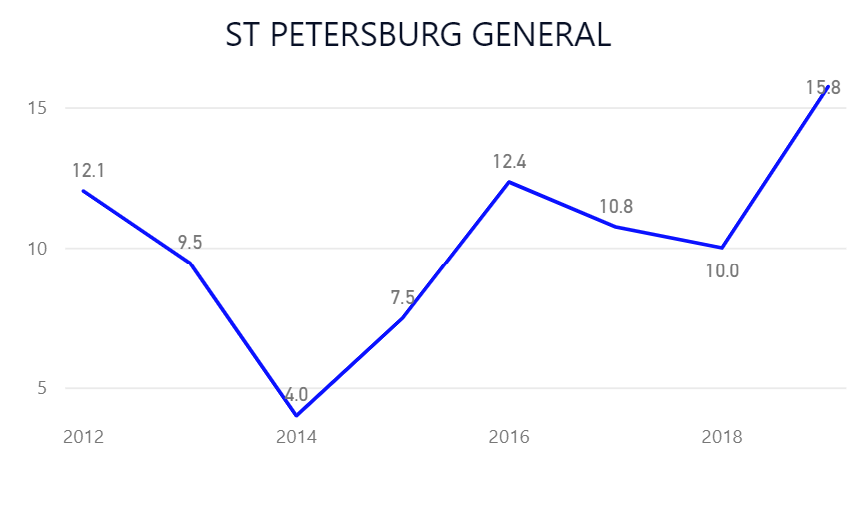
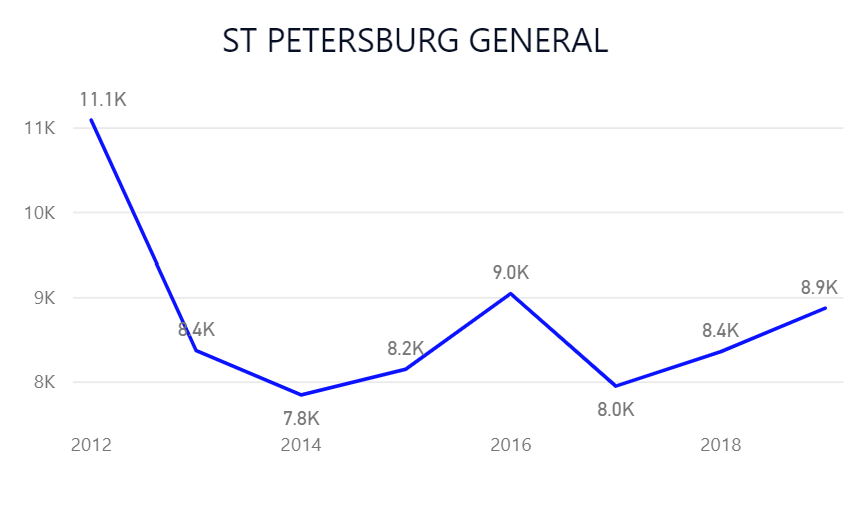
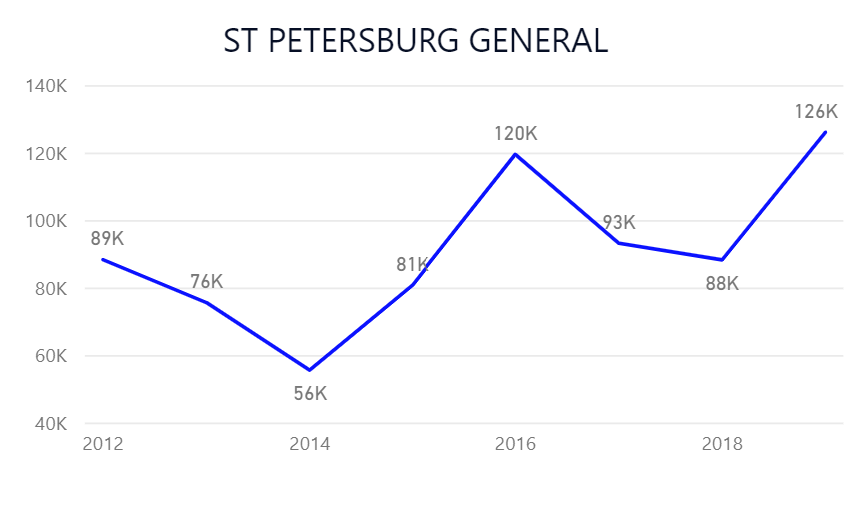
HCA’s St. Petersburg General
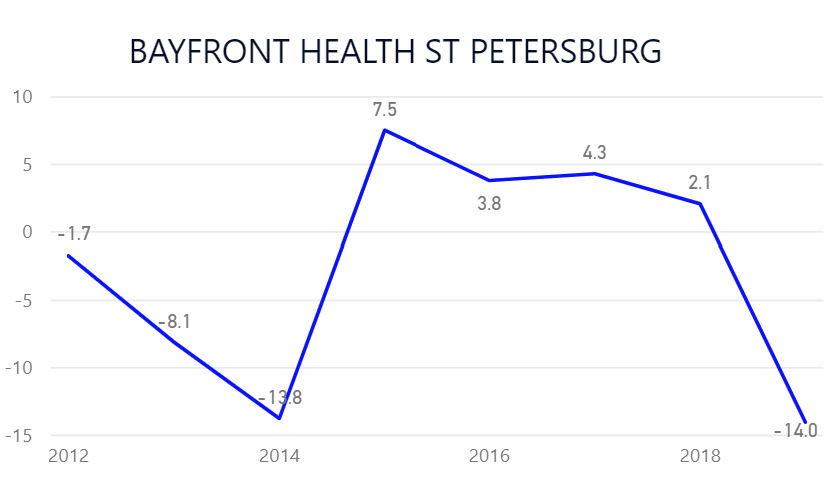
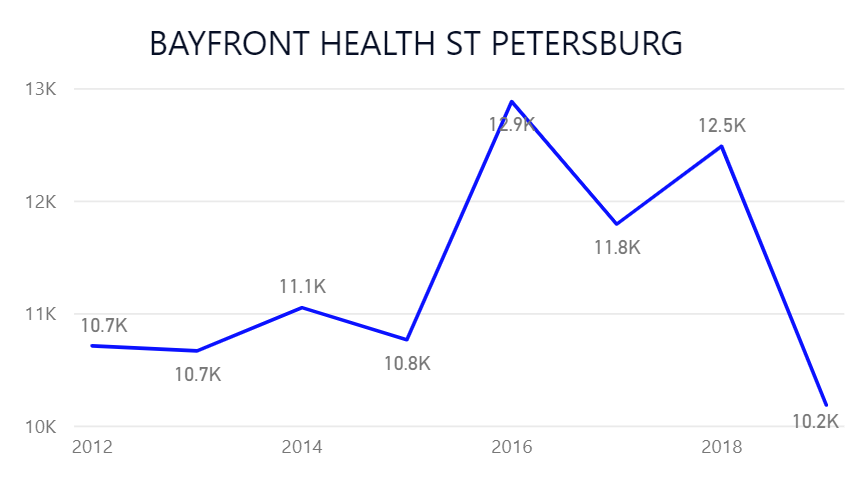
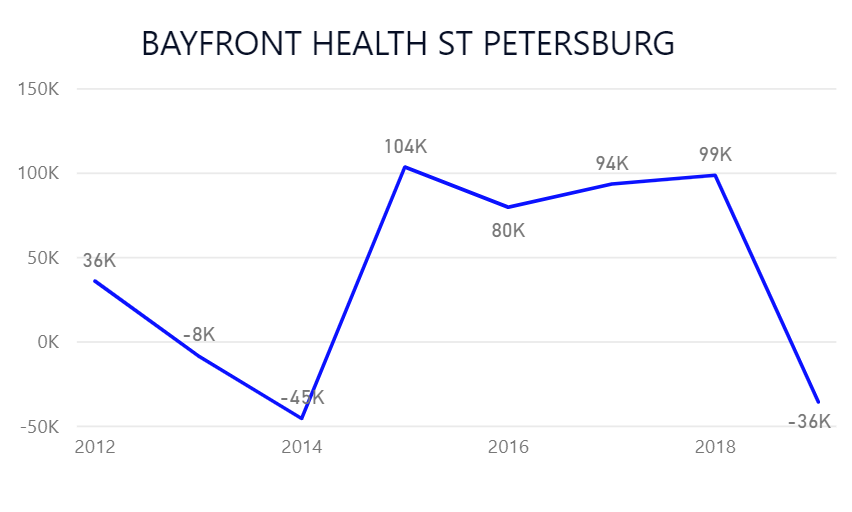
CHS’s Bayfront Health
Diving into these trajectories:
St Petersburg General (HCA) is growing.
- Inpatient growth comes from pricing and share gain
- Captures a majority share of affiliated Practitioners
- Over half of Patient Revenue comes from Outpatient
- Outpatient growth comes from volume and pricing
- Net patient revenue / CMI adj. disch. is up +8.6%
Bayfront Health (CHS) is flattening out.
- Inpatient is stagnant with share loss in most markets
- Occupancy is dropping
- Outpatient is less than 30% of total revenue
- Outpatient growth is softening
- Net patient revenue / CMI adj. disch. is down -20%
HCA’s St. Petersburg General (168 Beds)
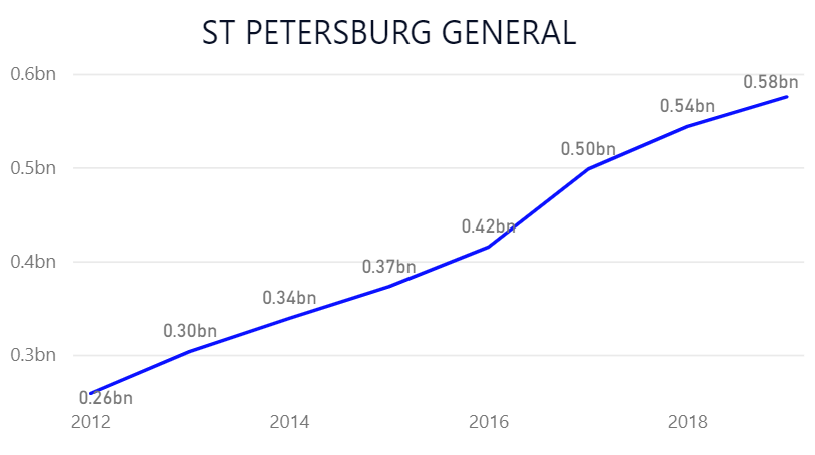
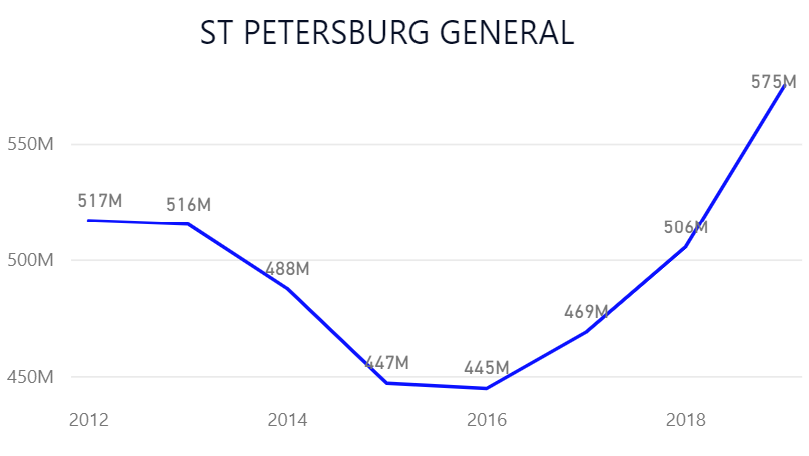
Continued growth in outpatient services that represent 50+% of Total Patient Revenue; strong I/P growth.
CHS’s Bayfront Health (358 Beds)
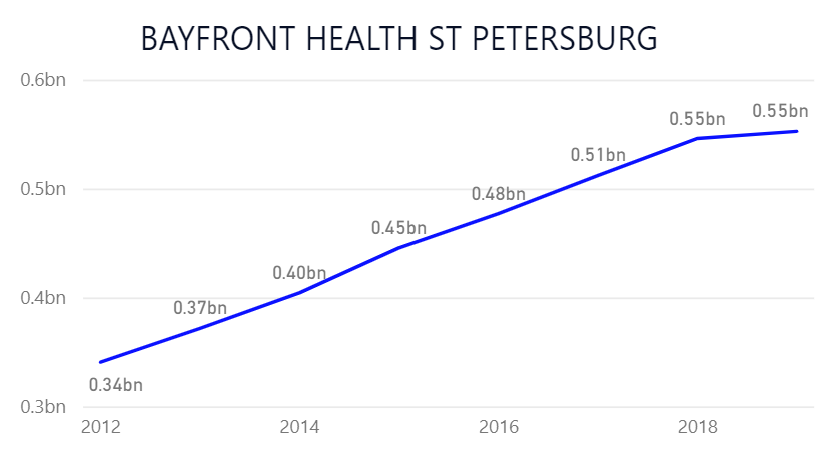
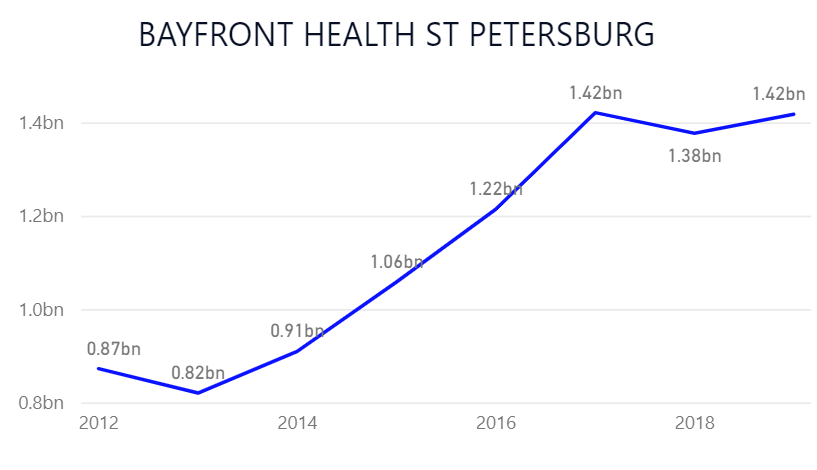
Flattening growth in both I/P and O/P services; with O/P representing a smaller portion of Total Revenue.
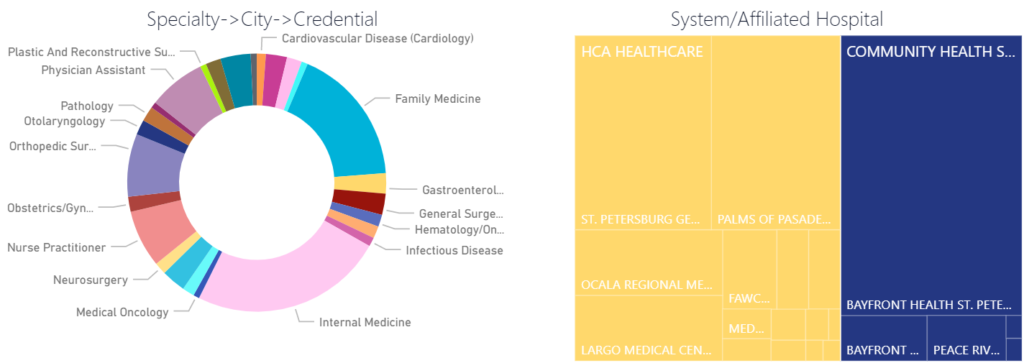
Service-line mix can define an organization’s strengths:
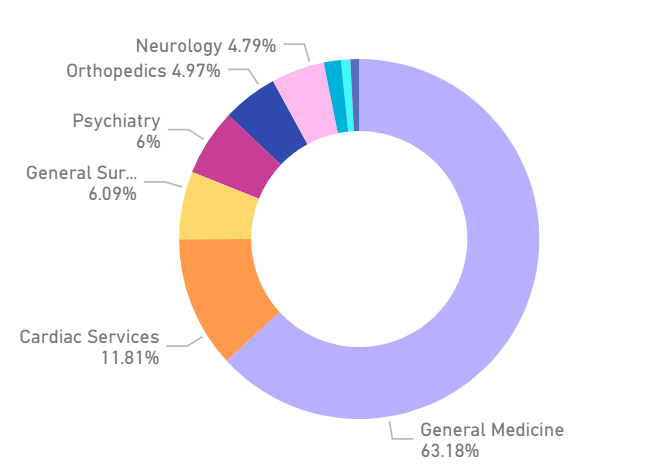
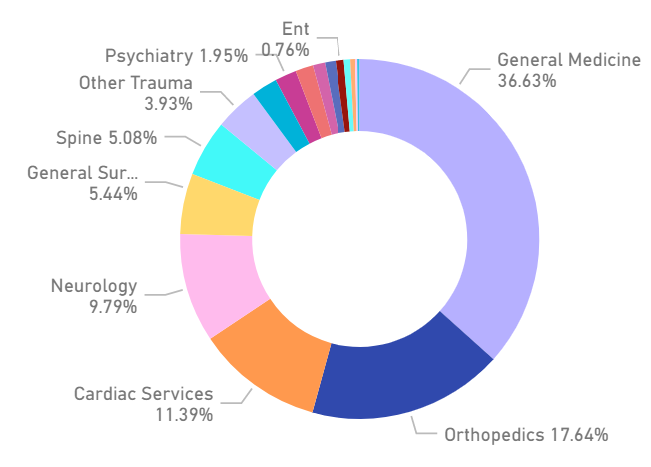
The Service-line mix is supported by the affiliated & referring physicians. With a larger footprint, HCA has more physician affiliations in the market supporting a significant General Medicine service line.
Find out what’s in your market.
To see a full deep dive of any facility or market, schedule a time below! We’ll show you a complete metric scan in minutes. Franklin:BI has thousands of operating, financial, quality, safety, clinical, physician, affiliation, market, market share, pricing, and productivity measures…. benchmarked, scored, ranked and trended.